SDL2 was released a little while ago, but still hasn’t made it into the stable repositories of some Linux distributions. After doing a big of digging, it’s not too hard to get this installed yourself - most of the advice offered in this post comes from an answer on the Ubuntu forums here.
In today’s post, we’ll install SDL2 on a Debian/Ubuntu style distribution from source.
Dependencies
First thing before we download and compile the SDL2 source is to get some of the dependencies installed on your system. The following install line will put all of the libraries that SDL2 requires:
Once all of these have installed successfully, you’ll need to download a copy of the source. All downloads can be found here. This guide will assume that you’ll download the .tar.gz source archive.
Compilation and Installation
Extract the package into a directory under your home directory, somewhere . . .
$ tar-xzf SDL2-*.tar.gz
$ cd SDL2-*
Next we’ll configure, build and install the libraries.
$ ./configure
$ make
$ sudo make install
Once compilation and installation have complete, you’ll need to update your library links/cache. Do this with the following command:
Noise functions in computer applications allow programmers to make the machine act a little more naturally. It’s the randomness introduced with these algorithms that gives the computer what appears to be “free thought” or unexpected decisions.
Today, I’ll walk through the Perlin Noise algorithm which has applications in computer science ranging from player movement, landscape generation, clouds, etc.
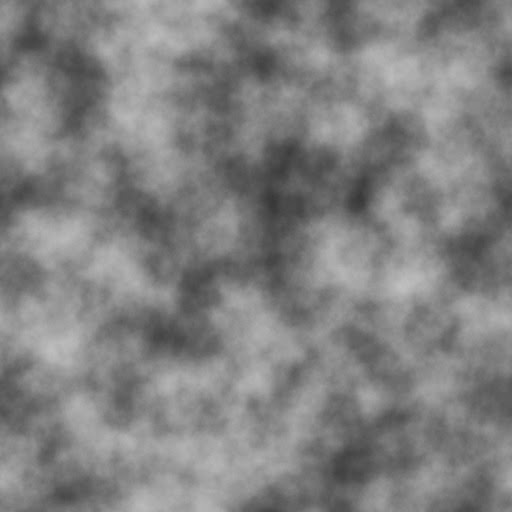
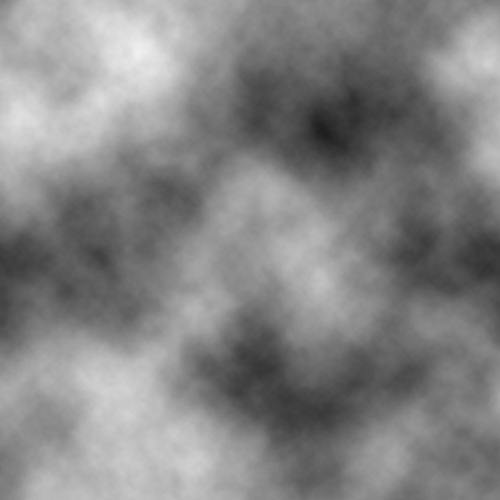
Here are some examples of the Perlin Noise function output into two dimensions:
In today’s post, I’ll walk through the Perlin Noise algorithm and what steps you need to take to implement it yourself.
Understanding Noise
The Perlin Noise algorithm can be broken down into a few smaller pieces to make it easier to understand. At its heart, the algorithm needs pseudo-random numbers. These random numbers should be repeatable so that you can re-generate the same noise pattern at will.
A common noise function for two parameters that I have found used over the web is as follows:
There’s a lot of math transformation in this previous function. You can use any function at all to produce your random numbers, just make sure that you can generate them against two parameters (in the case of 2d) and that you’ll get repeatable results.
Next we’ll smooth out the noise between two points. We’ll do this by sampling the corners, sides and centre of the point we’re currently generating for.
floatsmoothNoise(constfloatx,constfloaty){intix=(int)x;intiy=(int)y;// sample the cornersfloatcorners=(noise(ix-1,iy-1)+noise(ix+1,iy-1)+noise(ix-1,iy+1)+noise(ix+1,iy+1))/16;// sample the sidesfloatsides=(noise(ix-1,iy)+noise(ix+1,iy)+noise(ix,iy-1)+noise(ix,iy+1))/8;// sample the centrefloatcentre=noise(ix,iy);// send out the accumulated resultreturncorners+sides+centre;}
With the above function, we can now sample a small area for a given point. All based on our random number generator.
For the fractional parts that occur between solid boundaries, we’ll use a specific interpolation method. I’ve defined two below. One that will do linear interpolation and one that will use cosine for a smoother transition between points.
/* Linear interpolation */floatlerp(floata,floatb,floatx){returna*(1-x)+b*x;}/* Trigonometric interpolation */floatterp(floata,floatb,floatx){floatft=x*3.1415927f;floatf=(1-cosf(ft))*0.5f;returna*(1-f)+b*f;}/* Noise interpolation */floatinterpolateNoise(constfloatx,constfloaty){intix=(int)x;floatfx=x-ix;intiy=(int)y;floatfy=y-iy;floatv1=smoothNoise(ix,iy),v2=smoothNoise(ix+1,iy),v3=smoothNoise(ix,iy+1),v4=smoothNoise(ix+1,iy+1);floati1=terp(v1,v2,fx),i2=terp(v3,v4,fx);returnterp(i1,i2,fy);}
Finally we use this smooth interpolation to perform the perlin noise function. A couple of interesting co-effecients that are provided to the algorithm are “octaves” and “persistence”. “octaves” defines how many iterations that will be performed and “persistence” defines how much of the spectrum we’ll utilise. It’s highly interactive to the main curve co-effecients: frequency and amplitude.
In a previous post I’d written about a simple camera implementation that you can use in projects of your own. This post I’ll show how I’ve implemented this camera with some mouse handling routines to make it feel like you’re orienting your head with the mouse.
The Idea
We’ll capture all of the mouse movements given in an application and see how far the mouse deviates from a given origin point. I think that the most sane origin point to go from is the center of your window. For each movement that the mouse makes from the center of the window, we need to:
Determine how much movement occurred on the x axis
Determine how much movement occurred on the y axis
Deaden this movement by a co-efficient to simulate mouse “sensitivity”
Set the yaw and pitch (head up/down, left/right) of the camera
Reset the mouse back to the origin point
Here’s how I’ve done it in code:
voidmouseMotion(intx,inty){// calculate the origin point (shifting right divides by two, remember!)inthalfWidth=windowWidth>>1;inthalfHeight=windowHeight>>1;// calculate how far we deviated from the origin point and deaden this// by a factor of 20floatdeltaX=(halfWidth-x)/20.0f;floatdeltaY=(halfHeight-y)/20.0f;// don't do anything if there wasn't any movement to reportif((deltaX==0.0f)&&(deltaY==0.0f)){return;}// set the camera's orientationcam.yaw(deltaX);cam.pitch(deltaY);// reset the mouse pointer back to the origin pointglutWarpPointer(halfWidth,halfHeight);}
You can see that I’m using GLUT to do these demos. The only GLUT-specific piece of code here is the warp command which puts the mouse back onto the origin point. You should have an equivalent function to do the same in the framework of your choice.
Well, there you have it. You can now orient your camera using your mouse.
One of the most important elements of any 3D application is its camera. A camera allows you to move around in your world and orient your view. In today’s post, I’ll put together a code walk through that will take you through a simple camera implementation.
The Concept
There are two major components of any camera. They are position and orientation. Position is fairly easy to grasp, it’s just where the camera is and is identified using a normal 3-space vector.
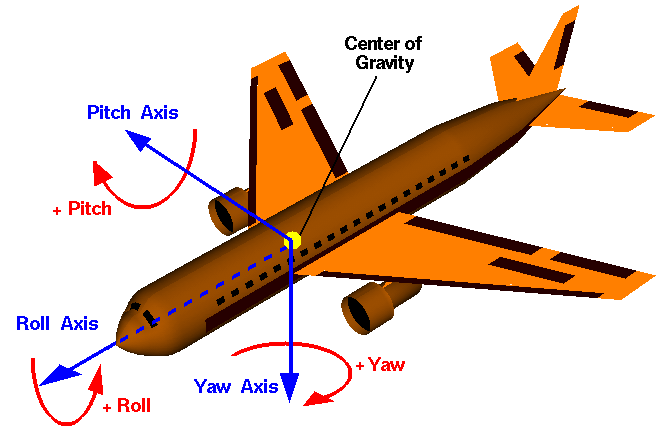
The more difficult of the two concepts is orientation. The best description for this that I’ve found is on the Flight Dynamics page on wikipedia. The following image has been taken from that article and it outlines the plains that orientation can occur. Of course, the image’s subject is an aircraft but the same concepts apply to a camera’s orientation:
The pitch describes the orientation around the x-axis, the yaw describes the orientation around the y-axis and the roll describes the orientation around the z-axis.
With all of this information on board, the requirements of our camera should become a little clearer. We need to keep track of the following about the camera:
Position
Up orientation (yaw axis)
Right direction (pitch axis)
Forward (or view) direction (roll axis)
We’ll also keep track of how far we’ve gone around the yaw, pitch and roll axis.
Some Maths (and code)
There’s a handful of really useful equations that are going to help us out here. With all of the information that we’ll be managing and how tightly related each axis is considering they’re all relating to the same object - you can see how interactive it can be just by modifying one attribute.
voidcamera::pitch(constfloatangle){// keep track of how far we've gone around the axisthis->rotatedX+=angle;// calculate the new forward vectorthis->viewDir=glm::normalize(this->viewDir*cosf(angle*PION180)+this->upVector*sinf(angle*PION180));// calculate the new up vectorthis->upVector=glm::cross(this->viewDir,this->rightVector);// invert so that positive goes downthis->upVector*=-1;}
voidcamera::yaw(constfloatangle){// keep track of how far we've gone around this axisthis->rotatedY+=angle;// re-calculate the new forward vectorthis->viewDir=glm::normalize(this->viewDir*cosf(angle*PION180)-this->rightVector*sinf(angle*PION180));// re-calculate the new right vectorthis->rightVector=glm::cross(this->viewDir,this->upVector);}
voidcamera::roll(constfloatangle){// keep track of how far we've gone around this axisthis->rotatedZ+=angle;// re-calculate the forward vectorthis->rightVector=glm::normalize(this->rightVector*cosf(angle*PION180)+this->upVector*sinf(angle*PION180));// re-calculate the up vectorthis->upVector=glm::cross(this->viewDir,this->rightVector);// invert the up vector so positive points downthis->upVector*=-1;}
Ok, so that’s it for orientation. Reading through the equations above, you can see that the calculation of the forward vector comes out of some standard rotations. The x operator that I’ve used above denotes vector cross product.
Now that we’re keeping track of our current viewing direction, up direction and right direction; performing camera movements is really easy.
I’ve called these advance (move along the forward plane), ascend (move along the up plane) and strafe (move along the right plane).
// z movementvoidcamera::advance(constfloatdistance){this->position+=(this->viewDir*-distance);}// y movementvoidcamera::ascend(constfloatdistance){this->position+=(this->upVector*distance);}// x movementvoidcamera::strafe(constfloatdistance){this->position+=(this->rightVector*distance);}
All we are doing here is just moving along those planes that have been defined for us via orientation. Movement is simple.
Integrating
All of this code/math is great up until we need to apply it in our environments. Most of the work that I do centralises around OpenGL, so I’ve got a very handy utility function (from GLU) that I use called gluLookAt. Plugging these values in is rather simple:
voidcamera::place(void){glm::vec3viewPoint=this->position+this->viewDir;// setup opengl with gluLookAtgluLookAt(position[0],position[1],position[2],viewPoint[0],viewPoint[1],viewPoint[2],upVector[0],upVector[1],upVector[2]);}
We calculate our viewpoint as (position - forwardVector) and really just plug the literal values into this function. There is a lot of information on the gluLookAt documentation page that you can use if OpenGL isn’t your flavor to simulate what it does.
GLUT is the OpenGL Utility Toolkit which is a standard set of APIs that you should be able to use on any platform to write OpenGL programs. It takes care of the boilerplate code that your applications would need to integrate with the host windowing system. More can be found about GLUT on its website.
Today’s post, I’ll focus on getting your Linux environment up to speed to start writing programs with this framework.
Installation
In order to write programs using this library, you’ll need to install the development library. Using your favorite package manager, you’ll need to install freeglut.
$ sudo apt-get install freeglut3-dev
After that’s finished, it’s time to write a test application to make sure everything went to plan.
A Simple Example
The following program will just open a window and continually clear the window.
#include<GL/glut.h>voidresize(intwidth,intheight){// avoid div-by-zeroif(height==0){height=1;}// calculate the aspect ratiofloatratio=width*1.0/height;// put opengl into projection matrix modeglMatrixMode(GL_PROJECTION);// reset the matrixglLoadIdentity();// set the viewportglViewport(0,0,width,height);// set the perspectivegluPerspective(45.0f,ratio,0.1f,100.0f);// put opengl back into modelview modeglMatrixMode(GL_MODELVIEW);}voidrender(void){// just clear the buffers for nowglClear(GL_COLOR_BUFFER_BIT|GL_DEPTH_BUFFER_BIT);// flip the buffersglutSwapBuffers();}intmain(intargc,char*argv[]){// initialize glutglutInit(&argc,argv);// setup a depth buffer, double buffer and rgba modeglutInitDisplayMode(GLUT_DEPTH|GLUT_DOUBLE|GLUT_RGBA);// set the windows initial position and sizeglutInitWindowPosition(50,50);glutInitWindowSize(320,240);// create the windowglutCreateWindow("Test Glut Program");// register the callbacks to glutglutDisplayFunc(render);glutReshapeFunc(resize);glutIdleFunc(render);// run the programglutMainLoop();return0;}
Putting this code into “test.c”, we built it into a program with the following command:
$ gcc test.c -lGL-lGLU-lglut-otest
That’s it! Run “test” at the command prompt and if everything has gone to plan, you’ve installed freeglut correctly!