The Banker’s Algorithm is a classic algorithm used in operating systems to manage resource allocation and avoid
deadlock, especially when dealing with multiple processes competing for limited resources. This problem provides an
opportunity to work with data structures and logic that ensure safe, deadlock-free allocation.
In this implementation, we’ll use Rust to simulate the Banker’s Algorithm. Here’s what we’ll cover:
Introduction to the Banker’s Algorithm: Understanding the problem and algorithm.
Setting Up the System State: Define resources, allocation, maximum requirements, and available resources.
Implementing the Safety Check: Ensure that allocations leave the system in a safe state.
Requesting and Releasing Resources: Manage resources safely to prevent deadlock.
Banker’s Algorithm
The Banker’s Algorithm operates in a system where each process can request and release resources multiple times. The
algorithm maintains a “safe state” by only granting resource requests if they don’t lead to a deadlock. This is done by
simulating allocations and checking if the system can still fulfill all processes’ maximum demands without running out
of resources.
Key components in the Banker’s Algorithm:
Available: The total number of each type of resource available in the system.
Maximum: The maximum demand of each process for each resource.
Allocation: The amount of each resource currently allocated to each process.
Need: The remaining resources each process needs to fulfill its maximum demand, calculated as Need = Maximum - Allocation.
A system is considered in a “safe state” if there exists an order in which all processes can finish without deadlock.
The Banker’s Algorithm uses this condition to determine if a resource request can be granted.
Implementation
We can now break this algorithm down and present it using rust.
Setting Up the System State
Let’s start by defining the structures to represent the system’s resources, maximum requirements, current allocation,
and needs.
available represents the system’s total available resources for each resource type.
maximum is a matrix where each row represents a process, and each column represents the maximum number of each resource type the process might request.
allocation is a matrix indicating the currently allocated resources to each process.
need is derived from maximum - allocation and represents each process’s remaining resource requirements.
Need breakdown
Taking the following piece of code, we can do a pen-and-paper walkthrough:
So, need is the remaining resource requirements for each process. This line of code efficiently computes it by
iterating and performing calculations on corresponding elements in maximum and allocation.
Implementing the Safety Check
The safety check function will ensure that, after a hypothetical resource allocation, the system remains in a safe
state.
Here’s the function to check if the system is in a safe state:
Work Vector: work represents the available resources at each step.
Finish Vector: finish keeps track of whether each process can complete with the current work allocation.
We loop through each process, and if the process’s need can be satisfied by work, we simulate finishing the process by adding its allocated resources back to work.
This continues until no further progress can be made. If all processes are marked finish, the system is in a safe state.
Requesting Resources
The request_resources function simulates a process requesting resources. The function will:
Check if the request is within the need of the process.
Temporarily allocate the requested resources and check if the system remains in a safe state.
If the system is safe, the request is granted; otherwise, it is denied.
implSystem{fnrequest_resources(&mutself,process_id:usize,request:Vec<i32>)->bool{ifrequest.iter().zip(&self.need[process_id]).any(|(req,need)|*req>*need){println!("Error: Process requested more than its need.");returnfalse;}ifrequest.iter().zip(&self.available).any(|(req,avail)|*req>*avail){println!("Error: Process requested more than available resources.");returnfalse;}// Pretend to allocate resourcesforiin0..request.len(){self.available[i]-=request[i];self.allocation[process_id][i]+=request[i];self.need[process_id][i]-=request[i];}// Check if the system is safeletsafe=self.is_safe();ifsafe{println!("Request granted for process {}",process_id);}else{// Roll back if not safeforiin0..request.len(){self.available[i]+=request[i];self.allocation[process_id][i]-=request[i];self.need[process_id][i]+=request[i];}println!("Request denied for process {}: Unsafe state.",process_id);}safe}}
Explanation:
The function checks if the request exceeds the need or available resources.
If the request can be granted, it temporarily allocates the resources, then calls is_safe to check if the new state is safe.
If the system remains in a safe state, the request is granted; otherwise, it rolls back the allocation.
Releasing Resources
Processes can release resources they no longer need. This function adds the released resources back to available and
reduces the process’s allocation.
implSystem{fnrelease_resources(&mutself,process_id:usize,release:Vec<i32>){foriin0..release.len(){self.available[i]+=release[i];self.allocation[process_id][i]-=release[i];self.need[process_id][i]+=release[i];}println!("Process {} released resources: {:?}",process_id,release);}}
Example Usage
Here’s how you might set up and use the system:
fnmain(){letavailable=vec![10,5,7];letmaximum=vec![vec![7,5,3],vec![3,2,2],vec![9,0,2],vec![2,2,2],];letallocation=vec![vec![0,1,0],vec![2,0,0],vec![3,0,2],vec![2,1,1],];letmutsystem=System::new(available,maximum,allocation);println!("Initial system state: {:?}",system);// Process 1 requests resourcessystem.request_resources(1,vec![1,0,2]);// Process 2 releases resourcessystem.release_resources(2,vec![1,0,0]);// Check the system stateprintln!("Final system state: {:?}",system);}
This setup demonstrates the core of the Banker’s Algorithm: managing safe resource allocation in a multi-process
environment. By using Rust’s safety guarantees, we’ve built a resource manager that can prevent deadlock.
Going Multithreaded
The Banker’s Algorithm, as traditionally described, is often presented in a sequential way to focus on the
resource-allocation logic. However, implementing a multi-threaded version makes it more realistic and challenging, as
you can simulate processes concurrently requesting and releasing resources.
Let’s extend this code to add a multi-threaded component. Here’s what we’ll do:
Simulate Processes as Threads: Each process will run in its own thread, randomly making requests for resources or releasing them.
Synchronize Access: Since multiple threads will access shared data (i.e., available, maximum, allocation, and need), we’ll need to use Arc and Mutex to make the data accessible and safe across threads.
Refactor the System Structure for Thread Safety
To allow multiple threads to safely access and modify the shared System data, we’ll use Arc<Mutex<System>> to wrap the
entire System. This approach ensures that only one thread can modify the system’s state at any time.
Now, we’ll use Arc<Mutex<System>> to safely share this System across multiple threads.
Implement Multi-Threaded Processes
Each process (thread) will:
Attempt to request resources at random intervals.
Either succeed or get denied based on the system’s safe state.
Occasionally release resources to simulate task completion.
Here’s how we might set this up:
fnmain(){letavailable=vec![10,5,7];letmaximum=vec![vec![7,5,3],vec![3,2,2],vec![9,0,2],vec![2,2,2],];letallocation=vec![vec![0,1,0],vec![2,0,0],vec![3,0,2],vec![2,1,1],];// Wrap the system in Arc<Mutex> for safe shared accessletsystem=Arc::new(Mutex::new(System::new(available,maximum,allocation)));// Create threads for each processletmuthandles=vec![];forprocess_idin0..4{letsystem=Arc::clone(&system);lethandle=thread::spawn(move||{letmutrng=rand::thread_rng();loop{// Generate a random request with non-negative values within a reasonable rangeletrequest=vec![rng.gen_range(0..=3),rng.gen_range(0..=2),rng.gen_range(0..=2),];// Attempt to request resources{letmutsys=system.lock().unwrap();println!("Process {} requesting {:?}",process_id,request);ifsys.request_resources(process_id,request.clone()){println!("Process {} granted {:?}",process_id,request);}else{println!("Process {} denied {:?}",process_id,request);}}thread::sleep(Duration::from_secs(1));// Occasionally release resources, ensuring non-negative valuesletrelease=vec![rng.gen_range(0..=2),rng.gen_range(0..=1),rng.gen_range(0..=1),];{letmutsys=system.lock().unwrap();sys.release_resources(process_id,release.clone());println!("Process {} released {:?}",process_id,release);}thread::sleep(Duration::from_secs(2));}});handles.push(handle);}// Wait for all threads to finish (they won't in this infinite example)forhandleinhandles{handle.join().unwrap();}}
Explanation of the Multi-Threaded Implementation
Random Resource Requests and Releases:
Each process generates a random request vector simulating the resources it wants to acquire.
It then locks the system to call request_resources, either granting or denying the request based on the system’s safety check.
After a short wait, each process may release some resources (also randomly determined).
Concurrency Management with Arc<Mutex<System>>:
Each process clones the Arc<Mutex<System>> handle, ensuring shared access to the system.
Before each request_resources or release_resources operation, each process locks the Mutex on System. This ensures that only one thread modifies the system at any given time, preventing race conditions.
Thread Loop:
Each thread runs in an infinite loop, continuously requesting and releasing resources. This simulates real-world processes that may continuously request and release resources over time.
Conclusion
The Banker’s Algorithm is a powerful way to manage resources safely, and Rust’s type system and memory safety features
make it well-suited for implementing such algorithms. By simulating requests, releases, and safety checks, you can
ensure the system remains deadlock-free. This algorithm is especially useful in operating systems, databases, and
network management scenarios.
By adding multi-threading to the Banker’s Algorithm, we’ve made the simulation more realistic, reflecting how processes
in a real system might concurrently request and release resources. Rust’s Arc and Mutex constructs ensure safe shared
access, aligning with Rust’s memory safety guarantees.
This multi-threaded implementation of the Banker’s Algorithm provides:
Deadlock Avoidance: Requests are only granted if they leave the system in a safe state.
Resource Allocation Simulation: Processes continually request and release resources, emulating a dynamic resource allocation environment.
Pathfinding is essential in many applications, from game development to logistics. A* (A-star) is one of the most
efficient algorithms for finding the shortest path in grid-based environments, such as navigating a maze or finding the
quickest route on a map. Combining the strengths of Dijkstra’s algorithm and greedy best-first search, A* is fast yet
accurate, making it a popular choice for pathfinding tasks.
In this guide, we’ll walk through implementing A* in Rust, using Rust’s unique ownership model to handle node
exploration and backtracking. We’ll also take advantage of data structures like priority queues and hash maps to keep
the algorithm efficient and Rust-safe.
Core Concepts and Data Structures
Priority Queue
A* relies on a priority queue to process nodes in the order of their path cost. In Rust, the BinaryHeap structure
provides a simple and efficient way to prioritize nodes based on their cost to reach the destination.
Hash Map
We’ll use a HashMap to keep track of the best cost found for each node. This allows for quick updates and retrievals
as we explore different paths in the grid.
Grid Representation
For simplicity, we’ll represent our grid as a 2D array, with each element holding a Node. A Node will store
information about its coordinates and path costs, including the estimated cost to reach the target.
Ownership and Memory Management in Rust
Rust’s ownership model helps us manage memory safely while exploring nodes. For example, as we create references to
neighboring nodes and update paths, Rust’s borrowing rules ensure we don’t accidentally create dangling pointers or
memory leaks.
For shared ownership, we can use Rc (reference counting) and RefCell to allow multiple nodes to reference each other
safely, making Rust both safe and efficient.
Implementation
Setup
First, let’s define the main components of our grid and the A* algorithm.
usestd::collections::{BinaryHeap,HashMap};usestd::cmp::Ordering;// Define a simple Node structure#[derive(Copy,Clone,Eq,PartialEq)]structNode{position:(i32,i32),g_cost:i32,// Cost from start to current nodeh_cost:i32,// Heuristic cost from current to target node}implNode{fnf_cost(&self)->i32{self.g_cost+self.h_cost}}// Implement Ord and PartialOrd to use Node in a priority queueimplOrdforNode{fncmp(&self,other:&Self)->Ordering{other.f_cost().cmp(&self.f_cost())// Reverse for min-heap behavior}}implPartialOrdforNode{fnpartial_cmp(&self,other:&Self)->Option<Ordering>{Some(self.cmp(other))}}
Initialize the Grid and Heuristic Function
A simple heuristic we’ll use here is the Manhattan distance, suitable for grids where movement is limited to horizontal
and vertical steps.
Initialization: We add the start node to the open_set with an initial g_cost of 0.
Exploration: We pop nodes from open_set, starting with the lowest f_cost. If a neighbor has a lower g_cost (cost so far) than previously recorded, we update its cost and re-insert it into open_set.
Backtracking: Once we reach the target, we backtrack through the came_from map to reconstruct the path.
Running the A* Algorithm
Finally, let’s run the algorithm to see the path from a start to target position:
This will display the sequence of nodes from start to target, giving us the shortest path using the A* algorithm.
We can restructure these functions to also add visual representations on screen.
usestd::collections::{BinaryHeap,HashMap};usestd::{cmp::Ordering,thread,time::Duration};// Define symbols for visualizationconstEMPTY:char='.';constSTART:char='S';constTARGET:char='T';constOPEN:char='+';constCLOSED:char='#';constPATH:char='*';#[derive(Copy,Clone,Eq,PartialEq)]structNode{position:(i32,i32),g_cost:i32,h_cost:i32,}implNode{fnf_cost(&self)->i32{self.g_cost+self.h_cost}}implOrdforNode{fncmp(&self,other:&Self)->Ordering{other.f_cost().cmp(&self.f_cost())}}implPartialOrdforNode{fnpartial_cmp(&self,other:&Self)->Option<Ordering>{Some(self.cmp(other))}}fnheuristic(start:(i32,i32),target:(i32,i32))->i32{(start.0-target.0).abs()+(start.1-target.1).abs()}fnastar(start:(i32,i32),target:(i32,i32),grid_size:(i32,i32))->Option<Vec<(i32,i32)>>{letmutopen_set=BinaryHeap::new();letmutcame_from=HashMap::new();letmutg_costs=HashMap::new();letmutclosed_set=Vec::new();open_set.push(Node{position:start,g_cost:0,h_cost:heuristic(start,target)});g_costs.insert(start,0);// Initial grid setupletmutgrid=vec![vec![EMPTY;grid_size.1asusize];grid_size.0asusize];grid[start.0asusize][start.1asusize]=START;grid[target.0asusize][target.1asusize]=TARGET;// Display progress with each iterationwhileletSome(current)=open_set.pop(){ifcurrent.position==target{returnSome(reconstruct_path(came_from,current.position,&mutgrid,start,target));}closed_set.push(current.position);grid[current.position.0asusize][current.position.1asusize]=CLOSED;display_grid(&grid);thread::sleep(Duration::from_millis(100));// Slow down for visualizationforneighboringet_neighbors(current.position,grid_size){lettentative_g_cost=g_costs[¤t.position]+1;iftentative_g_cost<*g_costs.get(&neighbor).unwrap_or(&i32::MAX){came_from.insert(neighbor,current.position);g_costs.insert(neighbor,tentative_g_cost);grid[neighbor.0asusize][neighbor.1asusize]=OPEN;open_set.push(Node{position:neighbor,g_cost:tentative_g_cost,h_cost:heuristic(neighbor,target),});}}}None}fnget_neighbors(position:(i32,i32),grid_size:(i32,i32))->Vec<(i32,i32)>{let(x,y)=position;letmutneighbors=Vec::new();for(dx,dy)in&[(0,1),(1,0),(0,-1),(-1,0)]{letnx=x+dx;letny=y+dy;ifnx>=0&&nx<grid_size.0&&ny>=0&&ny<grid_size.1{neighbors.push((nx,ny));}}neighbors}fnreconstruct_path(came_from:HashMap<(i32,i32),(i32,i32)>,mutcurrent:(i32,i32),grid:&mutVec<Vec<char>>,start:(i32,i32),target:(i32,i32))->Vec<(i32,i32)>{letmutpath=Vec::new();whileletSome(&prev)=came_from.get(¤t){path.push(current);current=prev;}path.reverse();for&(x,y)in&path{grid[xasusize][yasusize]=PATH;}grid[start.0asusize][start.1asusize]=START;grid[target.0asusize][target.1asusize]=TARGET;display_grid(&grid);path}fndisplay_grid(grid:&Vec<Vec<char>>){println!("\x1B[2J\x1B[1;1H");// Clear the screenforrowingrid{forcellinrow{print!("{} ",cell);}println!();}}fnmain(){letstart=(0,0);lettarget=(7,9);letgrid_size=(10,10);matchastar(start,target,grid_size){Some(path)=>{println!("Path found: {:?}",path);}None=>{println!("No path found");}}}
Explanation
display_grid: This function clears the screen and then prints the current state of the grid to visualize the progress.
Thread Sleep: A short delay is added to slow down the iteration for visual effect. You can adjust Duration::from_millis(100) to control the speed.
Symbols:
. (OPEN): Nodes being considered.
# (CLOSED): Nodes already explored.
* (PATH): Final path from start to target.
After running this code, you should see the path being solved from one point to another:
The A* algorithm can be optimized by tuning the heuristic function. In Rust, using BinaryHeap and HashMap helps
manage the exploration process efficiently, and Rust’s ownership model enforces safe memory practices.
A* in Rust is an excellent example of how the language’s unique features can be leveraged to implement classic
algorithms effectively. Rust’s focus on memory safety and efficient abstractions makes it a strong candidate for
implementing pathfinding and other performance-sensitive tasks.
Concurrency can feel tricky to manage, especially in a language like Rust where memory safety is strictly enforced. The
Producer-Consumer pattern, however, provides a clean way to manage workloads between multiple threads, ensuring data is
processed as it’s produced. In this post, we’ll explore this pattern by building a prime number checker in Rust.
We’ll use a producer to generate candidate numbers and several consumers to check each candidate’s primality.
By the end of this post, you’ll understand how to manage shared data between threads, use an atomic flag for graceful
termination, and leverage Rust’s concurrency tools.
The Producer-Consumer Pattern
In the Producer-Consumer pattern, one or more producers generate data and place it in a shared buffer. Consumers
then take this data from the buffer and process it. This pattern is great for tasks that can be distributed, as it
allows producers and consumers to run concurrently without overwhelming the system.
In our example, the producer is a main thread that generates numbers for prime-checking, while the consumers are
threads that take these numbers and determine if they are prime. Here’s what we’ll build:
A producer (main thread) to generate candidate numbers.
A shared buffer where the candidates are stored.
Consumers (worker threads) that retrieve numbers from the buffer and check their primality.
An atomic stop flag to catch SIGINT (Ctrl+C) and cleanly stop the program.
Code Overview
Let’s break down the code section by section.
Setting Up Shared State
First, we need to set up the shared data structures for our threads. Rust provides a few useful tools for this: Arc,
Mutex, and AtomicBool.
Arc<T> (Atomic Reference Counting) allows us to share ownership of data between threads.
Mutex<T> protects shared data, ensuring only one thread can access it at a time.
AtomicBool is a thread-safe boolean that can be modified atomically, which we’ll use to signal our threads when it’s time to stop.
usestd::sync::{Arc,Mutex,atomic::{AtomicBool,Ordering}};usestd::thread;usestd::time::Duration;usectrlc;fnmain(){// small primes for checking divisibilityletprimes=vec![2,3,5,7,11,13,17];// shared buffer with Mutex and Arcletcandidates_mutex=Arc::new(Mutex::new(vec![]));// this is our kill switchletstop_flag=Arc::new(AtomicBool::new(false));// here's where we're currently up to in the candidate checkletmutcurrent=20;
Here, candidates_mutex is an Arc<Mutex<Vec<u32>>> — an atomic reference-counted mutex around a vector of candidate
numbers. By wrapping our vector with Mutex, we ensure that only one thread can modify the buffer at any time,
preventing race conditions.
The stop_flag is an AtomicBool, which will allow us to signal when it’s time for all threads to stop processing.
We’ll look at how to use this flag in the section on handling SIGINT.
Stopping Gracefully
When running a multi-threaded application, it’s essential to handle termination gracefully. Here, we’ll use the ctrlc
crate to catch the SIGINT signal (triggered by Ctrl+C) and set stop_flag to true to signal all threads to stop.
The store function sets the value of stop_flag to true, and we use Ordering::SeqCst to ensure all threads see
the change immediately. This will stop all consumers from further processing once they check the flag.
Creating the Consumer Threads
Now that we have a stop flag and a shared buffer, we can create our consumer threads. Each consumer thread will:
Check the stop_flag.
Attempt to retrieve a candidate number from candidates_mutex.
Check if the candidate is prime.
Here’s the code:
lethandles:Vec<_>=(0..3).map(|_|{// clone all of our concurrent structures for each threadletcandidates_mutex=Arc::clone(&candidates_mutex);letprimes=primes.clone();letstop_flag_clone=stop_flag.clone();thread::spawn(move||{// we make sure that we're still "running"while!stop_flag_clone.load(Ordering::SeqCst){letcandidate={// lock the mutex to get a candidate numberletmutcandidates=candidates_mutex.lock().unwrap();candidates.pop()};// check that a candidate was availableifletSome(num)=candidate{// perform a primality check (basic division check for illustration)letis_prime=primes.iter().all(|&p|num%p!=0||num==p);ifis_prime{println!("{} is prime",num);}else{println!("{} is not prime",num);}}else{// If no candidates are available, wait a moment before retryingthread::sleep(Duration::from_millis(10));}}})}).collect();
Explanation
Each consumer thread runs a loop, checking the stop_flag using the .load(Ordering::SeqCst) function on AtomicBool. This function reads the current value of stop_flag, and with Ordering::SeqCst, we ensure that all threads see consistent updates.
Inside the loop, the thread locks the candidates_mutex to safely access candidates.
If a candidate is available, the thread checks its primality using modulus operations. If no candidate is available, it sleeps briefly before trying again, minimizing CPU usage.
Why .clone()?
You’ll notice at the start of the thread’s execution, we setup a group of clones to work with.
If you’re new to Rust, you might wonder why we need to clone our Arc references when passing them to threads. In many
languages, you can freely share references between threads without much consideration. Rust, however, has strict rules
about data ownership and thread safety, which is why cloning Arcs becomes essential.
Rust’s Ownership Model and Shared Data
Rust enforces a strong ownership model to prevent data races, requiring that only one thread can “own” any piece of data
at a time. This rule ensures that data cannot be modified simultaneously by multiple threads, which could lead to
unpredictable behavior and bugs.
However, our prime-checker example needs multiple threads to access shared data (the list of candidates), which would
normally violate Rust’s ownership rules. To make this possible, we use Arc and Mutex:
Arc<T>: Atomic Reference Counting for Shared Ownership
Arc stands for Atomic Reference Counted, and it enables multiple threads to safely share ownership of the same data.
Unlike a regular reference, Arc keeps a reference count, incremented each time you “clone” it. When the reference
count drops to zero, Rust automatically deallocates the data.
Each clone of an Arc doesn’t copy the data itself; it only adds a new reference, allowing multiple threads to safely
access the same data.
Mutex<T>: Ensuring Safe Access
Wrapping the shared data (in this case, our vector of candidates) in a Mutex allows threads to lock the data for
exclusive access, preventing simultaneous modifications. The combination of Arc and Mutex gives us shared, safe, and
controlled access to the data across threads.
Why Clone and Not Move?
You might wonder why we don’t simply “move” the Arc into each thread. Moving the Arc would transfer ownership to a
single thread, leaving it inaccessible to other threads. Cloning allows us to create additional references to the same
Arc, giving each thread access without compromising Rust’s ownership and thread-safety guarantees.
In essence, cloning an Arc doesn’t duplicate the data; it just creates another reference to it. This approach allows
multiple threads to access shared data while still adhering to Rust’s safety guarantees.
By using Arc for shared ownership and Mutex for safe, exclusive access, we can implement the Producer-Consumer
pattern in Rust without breaking any ownership or thread-safety rules.
Producing Prime Candidates
Now, let’s look at the producer, which is responsible for generating numbers and adding them to the shared buffer. Here’s how it works:
// Main thread generating numbersloop{// if we get the stop flag, we stop producing candidatesifstop_flag.load(Ordering::SeqCst){println!("Main thread stopping...");break;}{// acquire a lock on the candidates vector as we need to push some new candidates onletmutcandidates=candidates_mutex.lock().unwrap();// 4 potential candidates per groups of 10candidates.push(current+1);candidates.push(current+3);candidates.push(current+7);candidates.push(current+9);println!("Added candidates, buffer size: {}",candidates.len());}// move on to the next group of 10current+=10;// slow down for illustrationthread::sleep(Duration::from_millis(1));}
The producer runs in a loop, checking stop_flag with .load(Ordering::SeqCst) to know when to stop. It then locks
candidates_mutex, adds numbers to the buffer, and increments current to generate new candidates.
This part ties back to the Producer-Consumer pattern: while the producer keeps generating numbers, the consumers
independently pull them from the shared buffer for prime-checking.
Finishing up
Finally, we ensure a clean exit by calling join on each consumer thread. This function blocks until the thread
completes, ensuring all threads finish gracefully.
// Wait for all threads to finishforhandleinhandles{handle.join().unwrap();}println!("All threads exited. Goodbye!");}
Conclusion
This project is a great way to explore concurrency in Rust. By applying the Producer-Consumer pattern, we can
efficiently manage workloads across threads while ensuring safety with Arc, Mutex, and AtomicBool.
Key takeaways:
AtomicBool and .load(Ordering::SeqCst): Allow threads to check for a termination signal in a consistent manner.
Mutex and Arc for Shared Data: Ensures that multiple threads can safely read and write to the same data.
Producer-Consumer Pattern: A practical way to distribute workloads and ensure efficient resource utilization.
By catching SIGINT, we also made our program resilient to unexpected terminations, ensuring that threads exit cleanly.
The dining philosophers problem is a classic synchronization and concurrency problem in computer science, illustrating
the challenges of managing shared resources. In this post, I’ll walk through an implementation of the dining
philosophers problem in Rust, explaining each part of the code to show how it tackles potential deadlocks and resource
contention.
You can find the full code listing for this article here.
The Problem
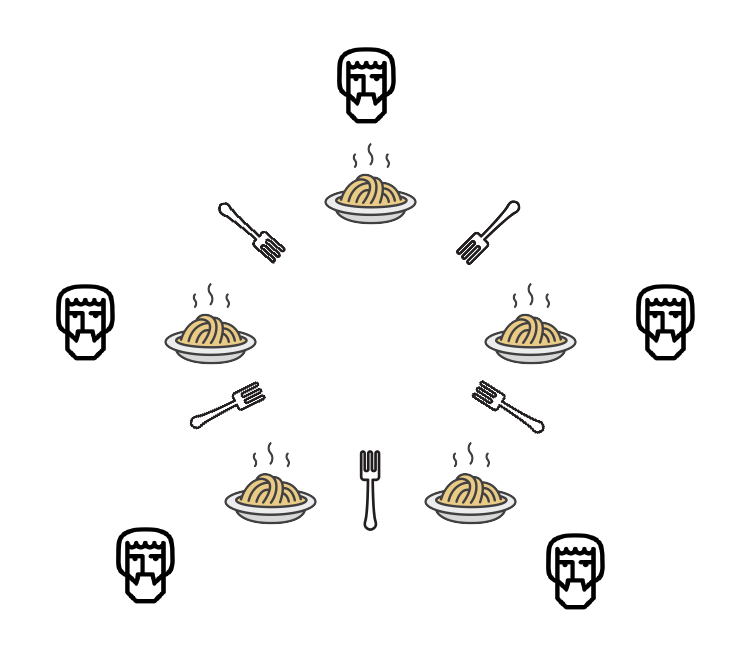
Imagine five philosophers seated at a round table.
Between each philosopher is a fork, and to eat, each philosopher needs to hold the fork to their left and the fork to their right.
This setup leads to a potential deadlock if each philosopher picks up their left fork at the same time, preventing any
of them from picking up their right fork.
To avoid this deadlock, our implementation uses randomized behavior to increase concurrency and reduce contention for
resources.
left and right are the two forks that this Philosopher is allowed to eat with
eaten is a counter, so we can see if anyone starves!
Arc<Mutex<T>>
left, right, and eaten are all typed with Arc<Mutex<T>>.
We use Arc<Mutex<T>> to share resources safely across threads. Arc (atomic reference counting) allows multiple
threads to own the same resource, and Mutex ensures that only one thread can access a resource at a time.
Implementing the Philosopher Struct
We can simplify building one of these structs with a new method:
We now want to simulate a Philosopher attempting to eat. This is where the Philosopher tries to acquire the forks needed.
We do this with the dine function.
fndine(&self){letmutrng=rand::thread_rng();loop{// Randomize the order in each dining attemptletreverse_order=rng.gen_bool(0.5);
Using a random number generator (rng), each philosopher randomly decides in which order to try to pick up forks. This
randomness reduces the chances of all philosophers trying to grab the same forks simultaneously.
Finding a Fork
The philosopher selects which fork to pick up first based on the randomized reverse_order.
Here, if reverse_order is true, the philosopher picks up the right fork first; otherwise, they pick up the left fork
first.
Attempting to Eat
To avoid deadlock, the philosopher only eats if they can successfully lock both forks. If both locks are acquired, they
eat, increment their eaten counter, and release the locks after eating.
ifletOk(_first)=left_first.try_lock(){ifletOk(_second)=right_second.try_lock(){println!("{} is eating ({})",self.name,*self.eaten.lock().unwrap());// Update eating counterifletOk(mutcount)=self.eaten.lock(){*count+=1;}thread::sleep(Duration::from_millis(1000));println!("{} has finished eating",self.name);}else{println!("{} couldn't get both forks and is thinking",self.name);}}else{println!("{} couldn't get both forks and is thinking",self.name);}
If either lock fails, the philosopher “thinks” (retries later). The use of try_lock ensures that philosophers don’t
wait indefinitely for forks, reducing the chance of deadlock.
After eating, a philosopher sleeps for a random time to avoid overlapping lock attempts with other philosophers.
Each philosopher’s dine function runs in its own thread, allowing them to operate concurrently. The main thread then
waits for all philosopher threads to finish.
Results
Your mileage may vary due to the random number generator, but you can see even distribution between the Philosophers as
the simulation runs. For brevity, I stripped all the other messages out of this output.
Jane is eating (0)
Kylie is eating (0)
Marie is eating (0)
Margaret is eating (0)
Kylie is eating (1)
Sally is eating (0)
Jane is eating (1)
Margaret is eating (1)
Sally is eating (1)
Marie is eating (1)
Margaret is eating (2)
Jane is eating (2)
Margaret is eating (3)
Marie is eating (2)
Margaret is eating (4)
Jane is eating (3)
Kylie is eating (2)
Sally is eating (2)
Conclusion
This implementation uses randomized fork-picking order and non-blocking try_lock calls to minimize the risk of
deadlock and improve concurrency. Each philosopher tries to acquire forks in different orders and backs off to “think”
if they can’t proceed, simulating a real-world attempt to handle resource contention without deadlock.
This approach highlights Rust’s power in building concurrent, safe programs where shared resources can be managed
cleanly with Arc and Mutex. The dining philosophers problem is a great example of Rust’s capabilities in handling
complex synchronization issues, ensuring a safe and efficient solution.
Quite some time ago, I wrote a post about a very simple Scissors,
Paper, Rock implementation using Haskell. In today’s post, I’d like to revisit that code and clean it up with some tests
now that I know a little more.
Avoiding so much do
One point is to avoid the use of do notation, when it’s not needed.
-- Map string to Movestr2Move::String->Movestr2Move"s"=Scissorsstr2Move"p"=Paperstr2Move"r"=Rockstr2Move_=Unknown-- Determine the move that beats the given movegetWinner::Move->MovegetWinnerScissors=RockgetWinnerRock=PapergetWinnerPaper=ScissorsgetWinnerUnknown=Unknown
These functions were previously do notated, can be simplified back to these translations. The usage of pattern
matching here also improves the readability of the code.
Improved randomness
What was being used before getStdGen has now been replaced with newStdGen, which gives us a new random generator
per game, improving the randomness.
main::IO()main=dogen<-newStdGen
Tests
To verify our game logic, some tests have been added using Hspec.
-- MainSpec.hsmoduleMainSpecwhereimportTest.HspecimportSystem.Random(mkStdGen)importMain-- Import your module heremain::IO()main=hspec$dodescribe"str2Move"$doit"converts 's' to Scissors"$str2Move"s"`shouldBe`Scissorsit"converts 'p' to Paper"$str2Move"p"`shouldBe`Paperit"converts 'r' to Rock"$str2Move"r"`shouldBe`Rockit"returns Unknown for invalid input"$str2Move"x"`shouldBe`Unknowndescribe"getWinner"$doit"Rock beats Scissors"$getWinnerScissors`shouldBe`Rockit"Paper beats Rock"$getWinnerRock`shouldBe`Paperit"Scissors beat Paper"$getWinnerPaper`shouldBe`Scissorsit"Unknown returns Unknown"$getWinnerUnknown`shouldBe`Unknowndescribe"getOutcome"$doit"returns Draw when both moves are the same"$getOutcomeRockRock`shouldBe`Drawit"returns Winner when player beats CPU"$getOutcomeRockScissors`shouldBe`Winnerit"returns Loser when CPU beats player"$getOutcomeScissorsRock`shouldBe`Loserit"returns ND for Unknown player move"$getOutcomeUnknownRock`shouldBe`NDit"returns ND for Unknown CPU move"$getOutcomeRockUnknown`shouldBe`NDdescribe"getCpuMove"$doit"returns Rock for seed 1"$getCpuMove(mkStdGen1)`shouldBe`Rockit"returns Scissors for seed 2"$getCpuMove(mkStdGen2)`shouldBe`Scissorsit"returns Paper for seed 3"$getCpuMove(mkStdGen3)`shouldBe`Paper
Here is the full code listing:
moduleMainwhereimportSystem.IOimportSystem.RandomdataMove=Scissors|Paper|Rock|Unknownderiving(Eq,Show)dataOutcome=Winner|Draw|Loser|NDderiving(Show)-- Map string to Movestr2Move::String->Movestr2Move"s"=Scissorsstr2Move"p"=Paperstr2Move"r"=Rockstr2Move_=Unknown-- Determine the move that beats the given movegetWinner::Move->MovegetWinnerScissors=RockgetWinnerRock=PapergetWinnerPaper=ScissorsgetWinnerUnknown=Unknown-- Calculate the outcome based on player and CPU movesgetOutcome::Move->Move->OutcomegetOutcomeplayercpu|player==Unknown||cpu==Unknown=ND|player==cpu=Draw|cpu==getWinnerplayer=Loser|otherwise=Winner-- Generate a CPU move based on random numbergetCpuMove::StdGen->MovegetCpuMovegen=casefst(randomR(1,3)gen::(Int,StdGen))of1->Rock2->Scissors3->Paper_->Unknown-- This case is unreachable but keeps pattern exhaustivemain::IO()main=dogen<-newStdGen-- Get a new generator each round for more randomnessputStr"Enter your choice (s, p, or r): "hFlushstdoutline<-getLineletplayer=str2Movelineifplayer==UnknownthenputStrLn"Invalid input! Please enter 's', 'p', or 'r'."elsedoletcpu=getCpuMovegenletoutcome=getOutcomeplayercpuputStrLn$"Player Chose: "++showplayerputStrLn$"CPU Chose : "++showcpuputStrLn$"Outcome : "++showoutcome