Making Sense of the Linux "top" Report
24 May 2013Introduction
Working in a Linux environment for more and more of the day, it pays to know your tools really well. One tool that I use frequently to understand what a machine is doing is the top command. Today’s post will take you through all of the figures on this report to help you understand what each means.
The Command
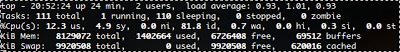
The top command is a very common tool used to “display Linux tasks” as the man page so helpfully tells us. Issuing this command at the shell will present the user with a few rows of figures followed by a list of all running processes on the system. Here is an extract of the report (just the upper lines that this post will focus on).
Breaking Down the Summary
You can see from the excerpt above that quite a lot of information is packed into this part of the report. To breakdown this report, I’ll just got through it line by line.
top - 20:52:24 up 24 min, 2 users, load average: 0.93, 1.01, 0.93The first line tells us the following:
- The current time (20:52:24)
- The machine’s up time (24 min)
- How many user sessions currently (2)
- The system’s load average for the last minute (0.93), last 5 minutes (1.01) and last 15 minutes (0.93)
The system load average is an interesting one. A general rule of thumb is to investigate if you’re seeing averages above 0.7. An average of 1.0 suggests that just enough work is getting processed by the machine, but is leaving you no headroom to move. Seeing a load of 5 and above is panic-time, systems stalling, trouble. For more information about these load values, take a look at Understanding Linux CPU Load - when should you be worried?
Tasks: 111 total, 1 running, 110 sleeping, 0 stopped, 0 zombieThe second line tells us the following:
- The total number of tasks (111)
- How many of those tasks are running (1)
- How many of them are sleeping (110)
- How many of them are stopped (0)
- and, How many of them are waiting to be stopped (or zombie) (0)
%Cpu(s): 12.3 us, 4.9 sy, 0.0 ni, 81.8 id, 0.7 wa, 0.0 hi, 0.3 si, 0.0 stThe third line gives you a point in time view of how busy the CPU is and where its cycles are being used. It tells us the percentage of CPU being used for:
- User applications (12.3 us)
- System applications (4.9 sy)
- Applications that have had their “nice” value adjusted (0.0 ni)
- Unused or Idle (81.8 id)
- Waiting for I/O operations (0.7 wa)
- Handling hardware interrupts (0.0 hi)
- Handling software interrupts (0.3 si)
- Stolen by the hypervisor (0.0 st)
KiB Mem:   8129072 total,  1402664 used,  6726408 free,    69512 buffers
KiB Swap:  9920508 total,        0 used,  9920508 free,   620016 cached
The fourth and fifth lines deal with memory and swap utilisation. It tells us the following:
- Total
- Used
- Free
- Buffers
- Cached
That’s it for the summary of the machine’s activity. These are all the aggregate values which will give you an “at a glance” feel for how the machine is going. The next part of this post will be all about reading specific information from the process report. Here’s an excerpt of the report.

Breaking Down the Process Report
To interrogate a single process, you can use the details within the process report. It will list out all of the processes currently managed by your system. The report columns as you look at it will provide the following information:
- The process ID (PID)
- The user who owns the process (USER)
- The priority (PR)
- The nice value (NI)
- Virtual memory used by the process (VIRT)
- Physical memory used by the process (RES)
- Shared memory for the process (SHR)
- Status of the process (S) (Sleeping, Running, Zombie)
- Percentage of CPU used by this process (%CPU)
- Percentage of memory used by this process (%MEM)
- The time that this process has been active (TIME+)
- The name of the process (COMMAND)
That’s it for the “top” command in Linux. Remember, always read the man pages for commands that you want to learn more about!