In a previous post I laid down some foundation code to get access to the pixel buffer when in context of a HTML canvas. Good for those who have experience writing graphics code directly against the video buffer - it almost feels like you’re writing to 0xA000 :-)<
Today’s post will focus on drawing polygons to the screen using scan lines.
Scan lines
The whole idea here is that a polygon can be represented on screen as a series of horizontal lines. Take the following picture for example. You can see the red and blue horizontal lines making up the filling of the polygon.
So, to define this all we do is take note of the minimum and maximum x values for every y-axis instance that there is a line on. We run through the array of values drawing horizontal lines at each instance, and then we have a polygon on screen - pretty easy.
Code
First of all, we’ll define our drawing primitive for a horizontal line.
varhline_c=function(x1,x2,y,w,r,g,b,a,buffer){// calculate the offset into the buffervarofs=(x1+y*w)*4;// draw all of the pixelsfor(varx=x1;x<=x2;x++){buffer[ofs]=r;buffer[ofs+1]=g;buffer[ofs+2]=b;buffer[ofs+3]=a;// move onto the next pixelofs+=4;}};
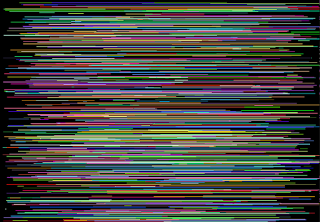
We pass in the two x (x1 and x2) values for the line to go between, the y value for the line to sit on. To help with the offset calculation we also pass in the width w to correctly calculate the pitch. Finally the colour components and buffer to draw to are passed in. Setting this code up in a run loop, you end up with something like this:
Yep, there’s lots of horizontal lines. Referring to our horizontal line diagram above, we still need a way to walk the edges of the polygon so that we can get the minimum and maximum x values to start drawing. Because our basic unit is the pixel (considering we’re rasterising to a pixelated display), we can easily calculate the gradient of the line that we need by:
(change in x) / (change in y)

For a line given by (x1, y1) - (x2, y2), this translates into:
(x2 - x1) / (y2 - y1)
Taken out of context of maths, this just says to us: we want to walk from x1 to x2 using (y2 - y1) steps.
varscanline_c=function(x1,y1,x2,y2,miny,edges){// flip the values if need beif(y1>y2){vary=y1;y1=y2;y2=y;varx=x1;x1=x2;x2=x;}// start at the startvarx=x1;// change in x over change in y will give us the gradientvardx=(x2-x1)/(y2-y1);// the offset the start writing at (into the array)varofs=y1-miny;// cover all y co-ordinates in the linefor(vary=y1;y<=y2;y++){// check if we've gone over/under the max/minif(edges[ofs].minx>x)edges[ofs].minx=x;if(edges[ofs].maxx<x)edges[ofs].maxx=x;// move along the gradientx+=dx;// move along the bufferofs++;}};
From the code above, we treat x1, y1 as the starting point and x2, y2 as the ending point. Our for-loop is biased in the positive direction, so it’s important for us to flip the values if they come in inverted. The edges array that’s passed in is prepared by the caller of this function. It’s initialized with very unreasonable minimum and maximum values. We than run over all 4 polygon edges
At the end of this process, edges is full of minimum/maximum values ready for drawing. Here’s the code for the polygon.
varpolygon_c=function(x1,y1,x2,y2,x3,y3,x4,y4,w,r,g,b,a,buffer){// work out the minimum and maximum y valuesvarminy=y1,maxy=y1;if(y2>maxy)maxy=y2;if(y2<miny)miny=y2;if(y3>maxy)maxy=y3;if(y3<miny)miny=y3;if(y4>maxy)maxy=y4;if(y4<miny)miny=y4;// the height will determine the size of our edges arrayvarh=maxy-miny;varedges=newArray();// build the array with unreasonable limitsfor(vari=0;i<=h;i++){edges.push({minx:1000000,maxx:-1000000});}// process each line in the polygonscanline_c(x1,y1,x2,y2,miny,edges);scanline_c(x2,y2,x3,y3,miny,edges);scanline_c(x3,y3,x4,y4,miny,edges);scanline_c(x4,y4,x1,y1,miny,edges);// draw each horizontal linefor(vari=0;i<edges.length;i++){hline_c(Math.floor(edges[i].minx),Math.floor(edges[i].maxx),Math.floor(i+miny),w,r,g,b,a,buffer);}};
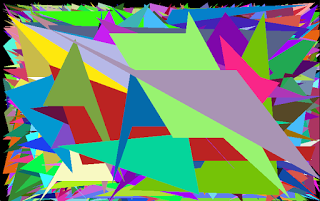
This really is just putting all the pieces together. The building of the edges array is important - as is using the y co-ordinate (adjusted back to zero by proxy of the minimum y value) as an array index. Once you’ve got this setup in a random position & colour loop, you’ll end up with something like this:
During the test phases of getting your software setup, you’ll find it useful to completely toast what ever data you’ve already indexed to start fresh. This is as simple as issuing a delete query with open criteria *.*. The full query should translate to
Gaining pixel-level access using the HTML canvas opens up some possibilities for some frame-buffer style rasterisation. Today’s post will focus on the code required to get you access to this array. Here’s the code on how to get started:
// create the canvas objectvarcanvas=document.createElement("canvas");// maximise the canvas to stretch over the windowcanvas.width=window.innerWidth;canvas.height=window.innerHeight;// get the 2d drawing context for varcxt=canvas.getContext("2d");// get the image datavarimageData=cxt.createImageData(width,height);// save off the dimensions for later usevarwidth=canvas.width;varheight=canvas.height;// get the canvas on the pagedocument.body.appendChild(canvas);
First of all, we programmatically create our canvas object using document.createElement. Using the inner dimensions of the window, we can then set the canvas’ size. Of course this can be custom set to the dimensions you require - I just like to take over the whole window! Using the canvas object, we then pull out the drawing context with getContext. The next part, using createImageData we then get a reference to the frame-buffer to draw to. This gives us read/write access to the canvas through an array. Finally, we’ll take note of the width and height (this will come in handy later) and then pop the canvas onto the page.
Frame-buffer structure
So, I say “frame-buffer” - but it’s just an array. It’s quite nicely laid out such that pixels start at every 4 elements within the array. The first element being the red component, second is green, third is blue and the fourth is the alpha. Calculating an offset into the array is a piece of cake. For example, take the following piece of code which will allow you to set a single pixel on the frame-buffer.
varsetPixel=function(x,y,r,g,b,a,buffer){// calculate the start of the pixelvaroffset=((y*width)+x)*4;// set the componentsbuffer[offset]=r;buffer[offset]=g;buffer[offset]=b;buffer[offset]=a;};
The main part to focus on here is the calculation of the offset. Above, I said it was important to take note of the dimensions - we’re only using the width here. This is pretty straight forward calculation of an offset within a linear data segment with Cartesian co-ordinates.
Flip out!
Now that we’ve drawn all of the data to the image buffer (frame-buffer), we need a way to get it back onto our canvas. This is simply done using putImageData.
After installing Debian within a few VMWare virtual machines, I keep getting a rather annoying and persistent message spamming out my unix mail box as well as /var/log/messages.
mpt-statusd: detected non-optimal RAID status
Simplest solution that I’ve come across is to just . . .
MongoDB is a great database, but one area that I’ve noticed it’s been deficient in is full text search. Thankfully, there are some great tools around that we can employ to compliment Mongo and give it this functionality. Today’s post will be a walk through to getting Solr & mongo-connector installed and configured on Debian Wheezy.
Get the software
First up, install Solr on tomcat with the tomcat administration tools
$ sudo apt-get install solr-tomcat tomcat6-admin
Straight after this has installed, you’ll need to configure a user to access these applications. Use your favorite text editor and open /etc/tomcat6/tomcat-users.xml. This file (like all of the configuration files) is really well commented. The steps I took here were:
Added a “role” node for “manager-gui”
Added “manager-gui” as a role to the “tomcat” user
In the end, you should have something sort-of like this:
Now that you’ve finished configuring all of the user access, restart tomcat.
$ sudo service tomcat restart
You can now check that tomcat is up and running by pointing your web browser at http://localhost:8080/. When you click on the manager-app link, you’ll be prompted for a username and password. As defined by the user configuration above, the username is “tomcat” and the password is “tomcat”. Have a click around, you should also see Solr installed in there also.
Solr Schema
Now it’s time we tell Solr exactly what we want to index. Remember, it’s going to be a client to our mongo database - so any interesting fields that you want indexed will need to be mentioned here. Solr’s schema file is found at /etc/solr/conf/schema.xml. Everyone’s requirements are way to broad for me to go into depth here on what to do, but it would be a good time to look up the documentation and learn about how you want your data attributed: http://wiki.apache.org/solr/SchemaXml.
Connecting to Mongo
Next, we’re going to connect Solr to mongo using mongo-connect. There’s some more software that’s needed to be installed here. mongo-connect is a python package that listens to mongo’s oplog for “interesting” things, and then stores them away into Solr for fast searching later. We will need pip, some xml dependencies that mongo-connect relies on - then we can install the connector.
Now that you’re all installed, it’s time to start indexing some data. Again, everyone’s requirements are going to be quite different - so it’s a good time to go out and take a look at the mongo-connector github page to understand the full usage of the command. A typical execution of the command would look like this: