Gouraud Shaing with Scan Line Polygons
20 Nov 2013Introduction
In my previous post, we went through the basics of rasterising polygons on screen by use of horizontal lines. To sum up, we interpolated values along each edge of the polygon, collecting minimum and maximums for each y-axis instance.
Today, we’re going to define a colour value for each point on the polygon and interpolate the colours along each edge. This is the technique employed to draw polygons that are Gouraud shaded.
The Code
The structure of this is very similar to drawing a single colour block polygon. For a solid colour polygon, we interpolated the x values over the length of the y values. We’ll now employ this same interpolation technique over the red, green, blue and alpha channels of each colour defined for each polygon point. Here’s the scanline function.
var scanline_g = function(p1, p2, miny, edges) {

   // if the y values aren't y1 < y2, flip them
   // this will also flip the colour components
   if (p2.y < p1.y) {
      var p = p1;
      p1 = p2;
      p2 = p;
   }

   // initialize our counters for the x-axis, r, g, b and a colour components
   var x = p1.x;
   var r = p1.r, g = p1.g, b = p1.b, a = p1.a;

   // calculate the deltas that we'll use to interpolate along the length of
   // the y-axis here (y2 - y1)
   var yLen = p2.y - p1.y;
   var dx = (p2.x - p1.x) / yLen;
   var dr = (p2.r - p1.r) / yLen;
   var dg = (p2.g - p1.g) / yLen;
   var db = (p2.b - p1.b) / yLen;
   var da = (p2.a - p1.a) / yLen;

   // find our starting array index
   var ofs = p1.y - miny;

   // enumerate each point on the y axis
   for (var y = p1.y; y <= p2.y; y ++) {

      // test if we have a new minimum, and if so save it
      if (edges[ofs].min.x > x) {
         edges[ofs].min.x = Math.floor(x);
         edges[ofs].min.r = Math.floor(r);
         edges[ofs].min.g = Math.floor(g);
         edges[ofs].min.b = Math.floor(b);
         edges[ofs].min.a = Math.floor(a);
      }

      // test if we have a new maximum, and if so save it
      if (edges[ofs].max.x < x) {
         edges[ofs].max.x = Math.floor(x);
         edges[ofs].max.r = Math.floor(r);
         edges[ofs].max.g = Math.floor(g);
         edges[ofs].max.b = Math.floor(b);
         edges[ofs].max.a = Math.floor(a);
      }

      // move our interpolators along their respective paths
      x += dx;
      r += dr;
      g += dg;
      b += db;
      a += da;

      // move to the next array offset
      ofs ++;

   }


};
An immediate code restructure difference here from the first tutorial, is I’m now passing an actual point object through as opposed to each component of each point being a function parameter. This is just to clean up the interface of these functions. We’re creating differentials not only for x now but also the r, g, b and a components. These will form the start and ending colours for each horizontal line that we’ll draw. We still have extra interpolation to do once we’re in the horizontal line draw function as well. Here it is.
var hline_g = function(x1, x2, y, w, c1, c2, buffer) {

   // calculate the starting offset to draw at
   var ofs = (x1 + y * w) * 4;
   // calculate the length of the line
   var lineLength = x2 - x1;

   // calculate the deltas for the red, green, blue and alpha channels
   var dr = (c2.r - c1.r) / lineLength;
   var dg = (c2.g - c1.g) / lineLength;
   var db = (c2.b - c1.b) / lineLength;
   var da = (c2.a - c1.a) / lineLength;

   // initialize our counters
   var r = c1.r, g = c1.g, b = c1.b, a = c1.a;

   // interpolate every position on the x axis
   for (var x = x1; x <= x2; x ++) {

      // draw this coloured pixel
      buffer[ofs] = Math.floor(r);
      buffer[ofs + 1] = Math.floor(g);
      buffer[ofs + 2] = Math.floor(b);
      buffer[ofs + 3] = Math.floor(g);

      // move the interpolators on
      r += dr; g += dg; b += db; a += da;

      // move to the next pixrl
      ofs += 4;
   }

};
Again, more interpolation of colour components. This is what will give us a smooth shading effect over the polygon. Finally, the actual polygon function is a piece of cake. It just gets a little more complex as we have to send in colours for each point defined.
var polygon_g = function(p1, p2, p3, p4, w, buffer) {
   // work out the minimum and maximum y values for the polygon
   var miny = p1.y, maxy = p1.y;

   if (p2.y > maxy) maxy = p2.y;
   if (p2.y < miny) miny = p2.y;
   if (p3.y > maxy) maxy = p3.y;
   if (p3.y < miny) miny = p3.y;
   if (p4.y > maxy) maxy = p4.y;
   if (p4.y < miny) miny = p4.y;

   var h = maxy - miny;
   var edges = new Array();

   // create the edge storage so we can keep track of minimum x, maximum x
   // and corresponding r, g, b, a components
   for (var i = 0; i <= h; i ++) {
      edges.push({

         min: {
            x: 1000000,
            r: 0,
            g: 0,
            b: 0,
            a: 0
         },

         max: {
            x: -1000000,
            r: 0,
            g: 0,
            b: 0,
            a: 0
         }

      });
   }

   // perform the line scans on each polygon egde
   scanline_g(p1, p2, miny, edges);
   scanline_g(p2, p3, miny, edges);
   scanline_g(p3, p4, miny, edges);
   scanline_g(p4, p1, miny, edges);

   // enumerate over all of the edge items
   for (var i = 0; i < edges.length; i ++) {
      // get the start and finish colour
      c1 = { r: edges[i].min.r, g: edges[i].min.g, b: edges[i].min.b, a: edges[i].min.a };
      c2 = { r: edges[i].max.r, g: edges[i].max.g, b: edges[i].max.b, a: edges[i].max.a };

      // draw the line
      hline_g(edges[i].min.x, edges[i].max.x, i + miny, w, c1, c2, buffer);
   }
};
Aside from the interface changing (just to clean it up a bit) and managing r, g, b and a components - this hasn’t really changed from the block colour version. If you setup this polygon draw in a render loop, you should end up with something like this: 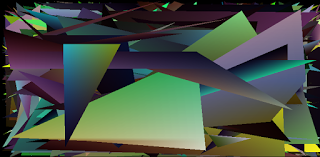
Smooth.