Using the GNU Debugger
25 Nov 2012Bundled with the GNU toolset is a full featured debugger in GDB. This blog post aims to be a cheatsheet to get yourself around this tool quickly.
The example program
int main(int argc, char *argv[]) {
  /* some local variables */
  int x = 1, y = 2, z = 0;

  /* something that will go bad */
  int ans = x / z;

  return 0;
}
Compile your code with debug info
You need to use the -g switch with GCC in order to compile debug symbols. This helps the feedback that GDB will give you a great deal.
$ gcc -g test.c -o testLoading your program into the debugger
So, in our example above the name of our executable would be “test”. So, we just tell gdb to load test by passing it in.
$ gdb testYou can even start gdb with a text user interface, so I’ve just discovered.
$ gdb test -tuiIt looks like this - not bad, eh?
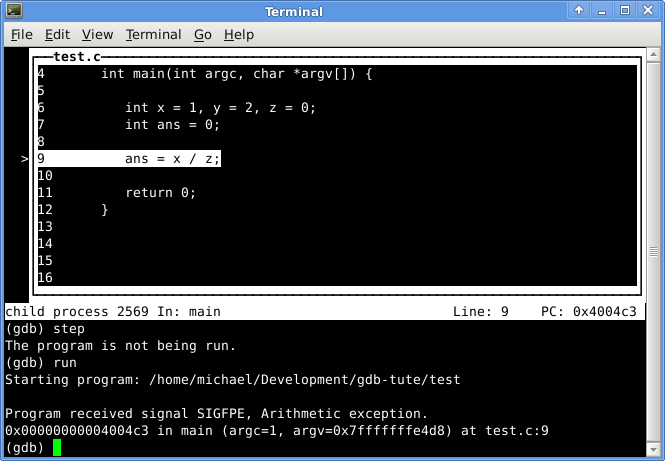
Now we instruct gdb that we’d like to run the application
(gdb) run
Starting program: /home/michael/Development/gdb-tute/test
Program received signal SIGFPE, Arithmetic exception.
0x00000000004004c3 in main (argc=1, argv=0x7fffffffe4d8) at test.c:9
9    ans = x / z;
So you can see here that dividing by zero wasn’t the best career move for this program. But It nicely let us know that there was an arithmetic exception on line 9!
Examining data
To get just the call stack information, we issue the “backtrace” instruction
(gdb) backtrace
#0  0x00000000004004c3 in main (argc=1, argv=0x7fffffffe4d8) at test.c:9
Examining data with print. We can view the value of variables by passing them to the print statement.
(gdb) print x
$1 = 1
(gdb) print y
$2 = 2
(gdb) print z
$3 = 0
Print also supports printf style specifiers. Examining data at an address. We can view the value of data at a memory location by using the x command.
(gdb) print &z
$4 = (int *) 0x7fffffffe3e8
(gdb) x 0x7fffffffe3e8
0x7fffffffe3e8: 0x00000000
Setting variables while attached is done with set. We can stop the error in the program at runtime using this mixed with a breakpoint.
Breakpoint 1, main (argc=1, argv=0x7fffffffe4d8) at test.c:6
6    int x = 1, y = 2, z = 0;
(gdb) next
7    int ans = 0;
(gdb) set (z = 5)
(gdb) print z
$1 = 5
Working with breakpoints
To set a breakpoint in gdb, just pass the name of what you’d like to break on to the break command.
(gdb) break main
Breakpoint 1 at 0x40049f: file test.c, line 6.
(gdb) run
Starting program: /home/michael/Development/gdb-tute/test
Breakpoint 1, main (argc=1, argv=0x7fffffffe4d8) at test.c:6
6    int x = 1, y = 2, z = 0;
You can set a breakpoint at a specific source code line number:
(gdb) break 7
Breakpoint 1 at 0x4004b4: file test.c, line 7.
Finally, you can make a breakpoint using a combination of source code file name and line location:
(gdb) break test.c:7
Breakpoint 3 at 0x4004b4: file test.c, line 7.
View your existing breakpoints with info breakpoints
(gdb) info breakpoints
Num     Type           Disp Enb Address            What
3       breakpoint     keep y   0x00000000004004b4 in main at test.c:7
You can clear any set breakpoint with clear.
(gdb) clear main
Deleted breakpoint 1
You can step into code by issuing the step command
(gdb) step
7    int ans = 0;
(gdb)
9    ans = x / z;
(gdb)
Program received signal SIGFPE, Arithmetic exception.
0x00000000004004c3 in main (argc=1, argv=0x7fffffffe4d8) at test.c:9
9    ans = x / z;
You step over code by issuing next. Its usage is the same as step.
That’s all for now. As I come across other useful bits from GDB, I’ll certainly post them here. The items above have been lifesavers for me from time to time.